

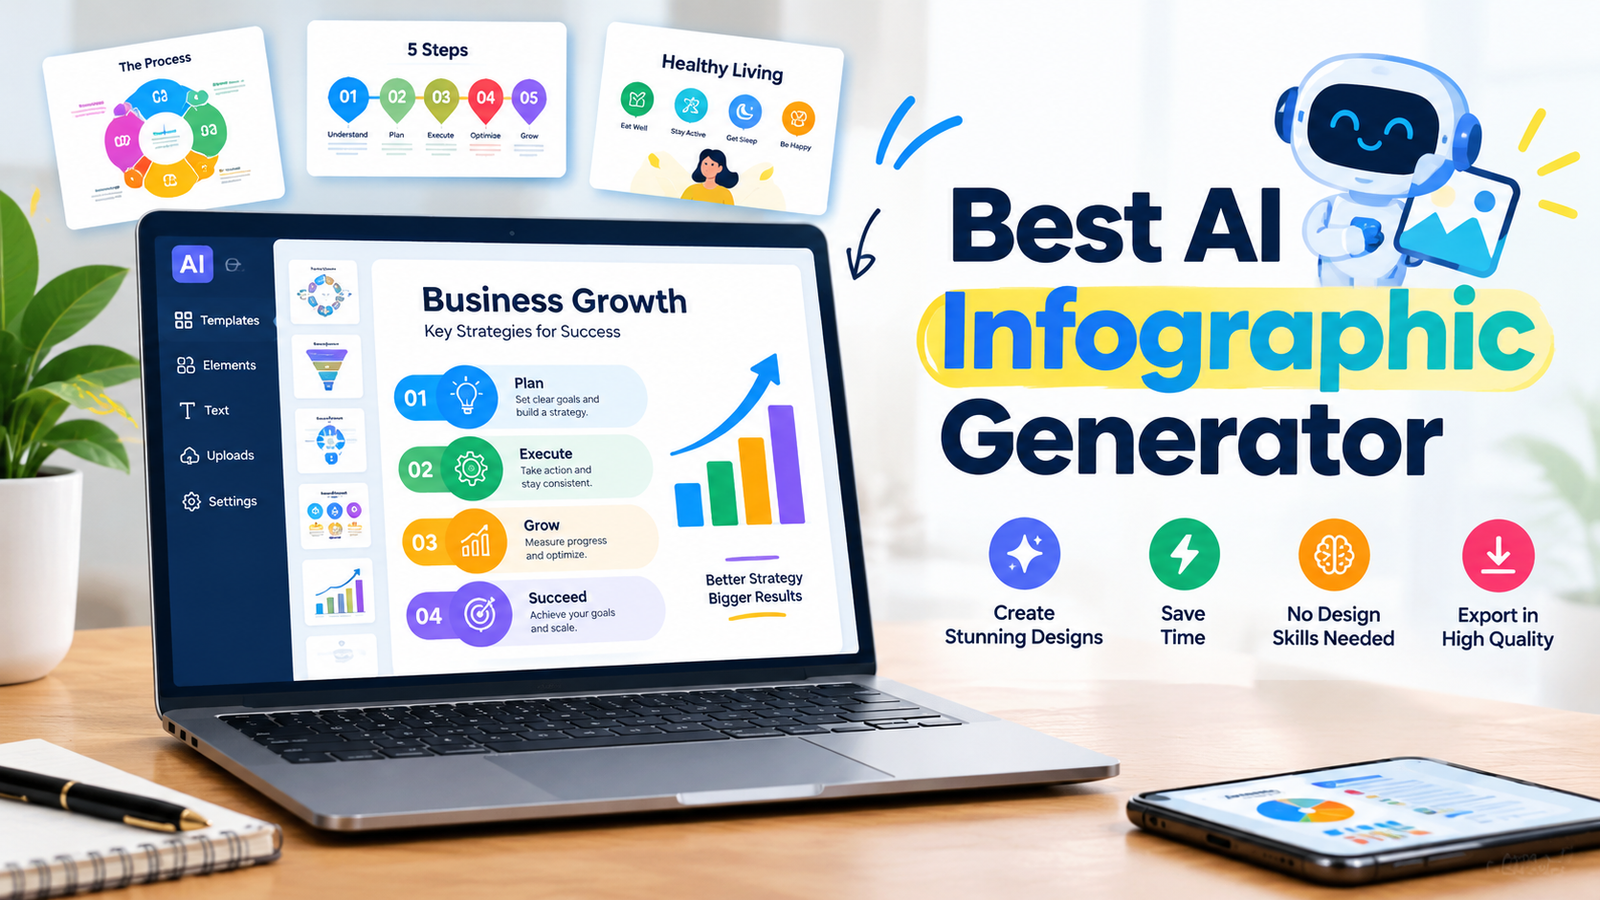
Creating a professional infographic once required design experience, expensive software, and hours of manual work. Today, AI has changed that process completely. The best AI infographic generator can turn a simple idea, written content, statistics, or complex data into an attractive visual within minutes.
Whether you are a blogger, marketer, student, business owner, educator, or content creator, AI infographic tools can help you communicate information more effectively. However, choosing the right platform can be difficult because every tool offers different strengths. Some are designed for creative visuals, while others are better for reports, charts, business presentations, or turning written content into graphics.
In this guide, we compare some of the best options available and explain which tool is right for different needs. We also cover free options, practical use cases, and what you should look for before choosing an AI-powered infographic maker.
Quick Comparison of the Best AI Infographic Generators
| AI Tool | Best For | Free Option | Main Strength |
| Canva | Overall design | Yes | Templates and customization |
| Venngage | Business visuals | Limited free features | Professional infographics |
| Piktochart AI | Reports and content | Yes | Turning content into visuals |
| Infogram | Data visualization | Yes | Charts and data storytelling |
| Adobe Express | Creative designs | Yes | AI-assisted creative design |
| Napkin AI | Simple concepts | Yes | Visual explanations |
| Powerdrill | Data and reports | Varies | Data-driven insights |
The best AI infographic generator for you depends on the type of content you want to visualize. A social media creator may prefer a design-focused tool, while a business analyst may need stronger chart and data capabilities.
How We Evaluated the Best AI Infographic Generator Tools
Choosing an AI tool based only on popularity is not always the best approach. A useful infographic generator should save time while still giving you control over the final design.
We evaluated the tools using several practical factors, including AI generation quality, ease of use, customization options, visual quality, data handling, free features, and overall value.
AI Generation Quality
A strong AI infographic generator should understand the information you provide and organize it into a logical structure. The goal is not simply to place text beside images. The AI should help identify important points and present them in a visually clear way.
Design and Visual Quality
Good infographics need readable typography, balanced layouts, clear sections, and strong visual hierarchy. The best tools make information easy to scan without overwhelming the reader.
Customization Options
AI can save time, but users still need creative control. The ability to change colors, fonts, images, layouts, and branding is important for professional use.
Data Accuracy
This is one of the most important factors when creating business, educational, or research-based infographics. AI-generated charts and summaries should always be checked before publishing.
Free Plan Value
A free AI infographic generator can be useful, but free plans often have limitations. These may include watermarks, limited exports, restricted AI credits, or fewer templates.
1. Canva — Best Overall for Flexible Design
Canva is one of the most popular choices for people who want an easy design experience combined with AI features. It offers a large collection of templates and allows users to create visuals for blogs, presentations, social media, and marketing campaigns.
Its drag-and-drop editor makes it particularly useful for beginners. You can start with an AI-generated idea and then manually customize nearly every part of the design.
Canva works well for users who want flexibility. Instead of relying entirely on automatic generation, you can combine AI assistance with templates and manual editing.
Best For
Bloggers, marketers, small businesses, students, and social media creators.
Pros
- Beginner-friendly interface
- Large template library
- Strong customization options
- Useful for multiple content formats
Cons
- Some premium features require a paid plan
- Complex data visualization may require more manual work
2. Venngage — Best for Professional Business Infographics
Venngage is designed for users who want professional-looking business visuals. It is especially useful for reports, company presentations, marketing materials, and internal communications.
The Venngage AI Infographic Generator can help users move from an idea to a structured design more quickly. Its templates and business-focused design options make it useful for teams that need consistent visual communication.
For businesses that regularly create reports or educational materials, Venngage can be a practical choice.
Best For
Businesses, marketing teams, consultants, and professional presentations.
Pros
- Professional templates
- Business-focused designs
- Useful branding options
- Easy editing tools
Cons
- Some advanced features are paid
- May be more than necessary for simple social media graphics
3. Piktochart AI — Best for Reports and Written Content
Piktochart AI is a strong choice for turning written information into visual content. It can be particularly helpful when you already have reports, documents, or long-form content that needs to become easier to understand.
This makes Piktochart AI useful for educators, businesses, researchers, and marketers. Instead of manually designing every section, users can start with their existing content and create a visual summary.
For example, a company could turn a long annual report into a concise infographic highlighting major statistics, achievements, and trends.
Best For
Reports, educational content, documents, and visual storytelling.
Pros
- Useful for content-heavy projects
- Beginner-friendly
- Professional layouts
- Helps simplify complex information
Cons
- Advanced customization may take time
- Some features may be limited on free plans
4. Infogram — Best for Data Visualization
Infogram is particularly useful when your infographic depends heavily on real numbers and charts. While design-focused AI tools are excellent for marketing visuals, data-focused platforms are often better for presenting statistics accurately.
You can use charts, graphs, maps, and other visual elements to make complex information easier to understand.
For example, a marketing team could visualize website traffic, conversion rates, and campaign performance in a single infographic.
Best For
Data analysts, researchers, businesses, and statistics-based content.
Pros
- Strong chart capabilities
- Useful for data storytelling
- Professional visualizations
- Good for reports
Cons
- Less focused on highly creative design
- Beginners may need time to understand advanced features
5. Adobe Express — Best for Creative Infographics
Adobe Express is a useful choice for users who want creative flexibility. It combines easy design tools with AI-assisted features and works well for marketing content, social media visuals, and branded graphics.
It is particularly useful for creators who want polished visuals without learning more advanced professional design software.
If your infographic needs strong visual appeal, creative images, and brand consistency, Adobe Express can be worth considering.
Best For
Content creators, marketers, and creative professionals.
6. Powerdrill — Best for Data and Reports
Powerdrill takes a more data-focused approach than traditional infographic design platforms. It can be useful when your starting point is structured information, reports, spreadsheets, or other data sources.
This makes it suitable for business users who want to transform information into easier-to-understand visual insights.
For example, instead of manually reviewing hundreds of spreadsheet entries, a team could identify important trends and present them visually.
Best For
Business reports, structured data, spreadsheets, and analytical content.
7. Napkin AI — Best for Simple Visual Explanations
Napkin AI is useful for transforming ideas and written concepts into simple visuals. It is particularly effective when you need to explain a process, workflow, relationship, or concept.
Rather than creating a traditional statistics-heavy infographic, Napkin AI can help users communicate ideas visually.
For example, a writer could explain a five-step marketing process using a clear visual flow rather than a long paragraph.
Best For
Educators, writers, teams, and concept visualization.
Design-First vs Data-First AI Infographic Tools
One important difference between AI infographic platforms is the type of content they are designed to handle.
Design-First Tools
Design-first tools focus primarily on appearance and creativity. They are useful for:
- Social media graphics
- Marketing campaigns
- Blog visuals
- Educational content
- Promotional infographics
Examples include Canva, Adobe Express, and Venngage.
Data-First Tools
Data-first tools focus more on statistics, reports, charts, and information accuracy. They are useful for:
- Business reports
- Research
- Financial information
- Analytics
- Statistics
Examples include Infogram, Powerdrill, and Piktochart AI.
Understanding this difference can make it much easier to choose the best AI infographic generator for your specific project.
How to Create an Infographic Using AI
Creating an infographic with AI is usually straightforward.
Step 1: Choose Your Topic
Start with a clear topic. For example, you might want to create an infographic about the benefits of email marketing.
Step 2: Prepare Your Information
Gather your important points, statistics, or written content. You can use a short prompt, a blog article, a document, or structured data depending on the tool.
Step 3: Choose an AI Infographic Generator
Select a tool based on your needs. Canva may be better for design flexibility, while Infogram may be better for data visualization.
Step 4: Enter Your Prompt
A useful prompt might be:
“Create a professional infographic explaining five benefits of email marketing for small businesses.”
Step 5: Generate the Visual
Allow the AI to create an initial layout. Review how the information has been organized.
Step 6: Check the Facts
Never assume that AI-generated information is completely accurate. Review statistics, names, dates, labels, and charts before publishing.
Step 7: Customize the Design
Adjust colors, fonts, images, and layouts to match your brand.
Step 8: Export and Publish
Export your infographic in the format you need, such as PNG, JPG, PDF, or another available format.
AI Infographic Generator From Text: Useful Prompt Examples
An AI infographic generator from text can be especially useful when you already have written content.
Here are a few practical examples.
Marketing Prompt
“Create a modern infographic showing five benefits of content marketing for small businesses.”
Educational Prompt
“Create a simple infographic explaining the water cycle for students.”
Data Prompt
“Turn this quarterly sales information into an infographic showing revenue growth and top-performing products.”
Social Media Prompt
“Create an engaging infographic with five productivity tips for remote workers.”
Blog Content Prompt
“Turn this article into an infographic featuring the main statistics and key takeaways.”
Clear prompts usually produce better results. Include the topic, audience, style, and important information you want the infographic to contain.
Best Free AI Infographic Generator Options
Many people specifically search for a free AI infographic generator because they want to test the technology before paying for a subscription.
The best AI tool for infographics free will depend on how many designs you need and what limitations you can accept. Canva and other platforms may offer free access with certain restrictions, while specialized tools may provide limited AI credits.
Before choosing a free plan, check the following:
- Are exports watermarked?
- How many AI generations are included?
- Can you download high-quality images?
- Are commercial-use options available?
- Can you customize the generated design?
A free tool can be excellent for occasional projects, but regular business use may require a paid plan with additional features.
Common Problems With AI-Generated Infographics
AI can save a significant amount of time, but it is not perfect.
Incorrect Information
AI may misunderstand information or generate inaccurate text. Always verify important facts.
Poor Text Layout
Some AI-generated visuals may include awkward text placement or difficult-to-read typography.
Generic Designs
Without customization, AI visuals can sometimes look similar to other generated content.
Misleading Charts
Data should be reviewed carefully. A visually attractive chart can still communicate information incorrectly.
Limited Creative Control
Some fully automated generators offer less flexibility than traditional design software.
How to Choose the Best AI Infographic Generator
The right choice depends on your goals.
Choose Canva if you want flexible design tools and easy customization.
Choose Venngage if you need professional business infographics.
Choose Piktochart AI if you regularly transform reports and written content into visuals.
Choose Infogram if your content depends heavily on data and charts.
Choose Adobe Express if creative design is your main priority.
Choose Powerdrill if you work with reports and structured information.
Choose Napkin AI if you want to explain ideas and processes visually.
Frequently Asked Questions
What is the best AI infographic generator?
The best AI infographic generator depends on your needs. Canva is a strong choice for flexible design, while Infogram is better suited to data visualization and Venngage is useful for professional business graphics.
Is there a free AI infographic generator?
Yes, several platforms offer free plans or limited free features. However, free plans may include restrictions on AI generations, exports, templates, or premium design elements.
Can AI create an infographic from text?
Yes. An AI infographic generator from text can analyze written information and organize key points into a visual layout.
Is Piktochart AI good for infographics?
Piktochart AI can be a good choice for turning reports, documents, and written content into visual summaries. It is particularly useful for educational and business content.
What is the best AI tool for infographics free?
The best AI tool for infographics free depends on the features you need. Compare AI limits, watermark policies, customization options, and export quality before choosing.
Is Napkin AI useful for creating infographics?
Napkin AI is particularly useful for visualizing ideas, concepts, workflows, and processes. It may be a better choice for simple visual explanations than complex data-heavy infographics.
Can I use AI-generated infographics commercially?
This depends on the platform and the assets used. Always review the tool’s current licensing and commercial-use policies before publishing an infographic for business purposes.
Final Thoughts
The best AI infographic generator is not necessarily the tool with the most features. The right platform is the one that matches the type of content you want to transform into a visual.
Canva is a strong option for flexible design, Venngage works well for professional business graphics, Piktochart AI is useful for content-heavy projects, and Infogram is a better fit for data visualization. Powerdrill can help with analytical information, while Napkin AI is useful for explaining ideas and processes.
The biggest advantage of AI infographic tools is speed, but quality still depends on human review. Check your facts, improve the layout, customize the design, and make sure the final infographic communicates information clearly. With the right tool and a well-written prompt, you can create professional visuals without spending hours designing them from scratch.
You May Also Read: Finn Wolfhard
